Home | Altura Blog |
Analytics – Comprehensive & Powerful Reporting comes to Bridge
April 6, 2021 | Altura Blog
Topic:
Healthy Ageing
On April 22, 2021 the highly anticipated redesign of the Bridge LMS reporting platform will be released. Dubbed Analytics, it looks very promising.
In order to ensure continuity between old and new, the current reporting platform (known as Insights) will continue to be supported until the third quarter of 2021 before being gradually phased out.
The new Analytics icon will appear directly below insights. Below we will cover the highlights. It is important to note that certain features and functionality may change prior to the release of Analytics on the 22nd of April.
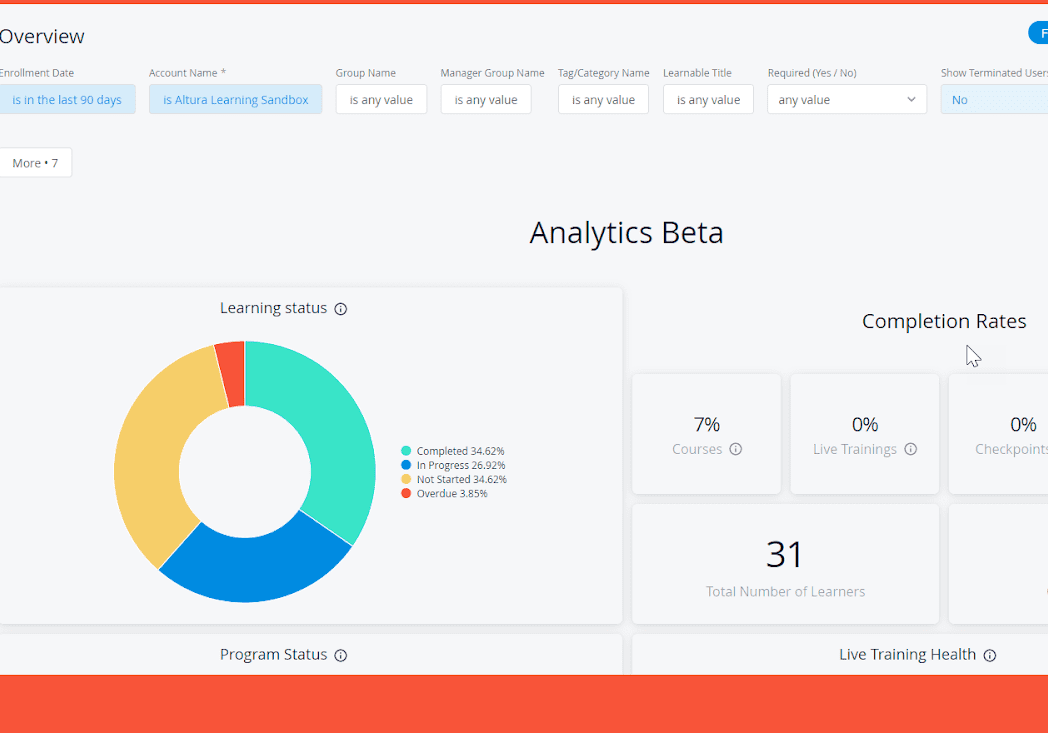
At this point, we know that there will be two distinct dashboards: Overview & Transcript. The overview Dashboard (see image below) will include Key Performance Indicators, Graphs and will have drill-down features. The Transcript Dashboard will contain a tabular report and will be accessible to learners and managers.
Altura will be creating learning resources and how-to-videos which will be available ahead of the release. We will also supplement these online resources with frequent webinars to run you through the new Analytics Tool.
Highlights:
- On Demand & Publish and subscribe reporting– It is now possible to arrange for a report to be delivered in a number of formats via numerous channels to the subscriber (See image below). Best of all, the automated reporting allows you to pick when you want to receive reports.
- All learnable types – Now all different types of learning are displayed side-by-side. For example, eLearning, Programs, Live Training & Checkpoints. Previously Live Training and Checkpoint reporting was limited.
- Bookmarking – The ability to bookmark report filters – Saving the user from repeating their filtering each time they view reports.
- Customisable Reporting – The Instructure developer team will be able to customise reports for Altura Customers. More on this to come.
We hope that you are all excited about the new reporting enhancements. The Instructure Team has made significant improvements to the reporting tool, which in turn should save you time and effort to create meaningful reports.
Helpful Links
Bridge Analytics -Walk Through Video
Bridge Analytics Overview Dashboard
Bridge Analytics Overview Transcripts


